ICAIR, the cumulative air index

Contenu
Contenu


A new index for air quality

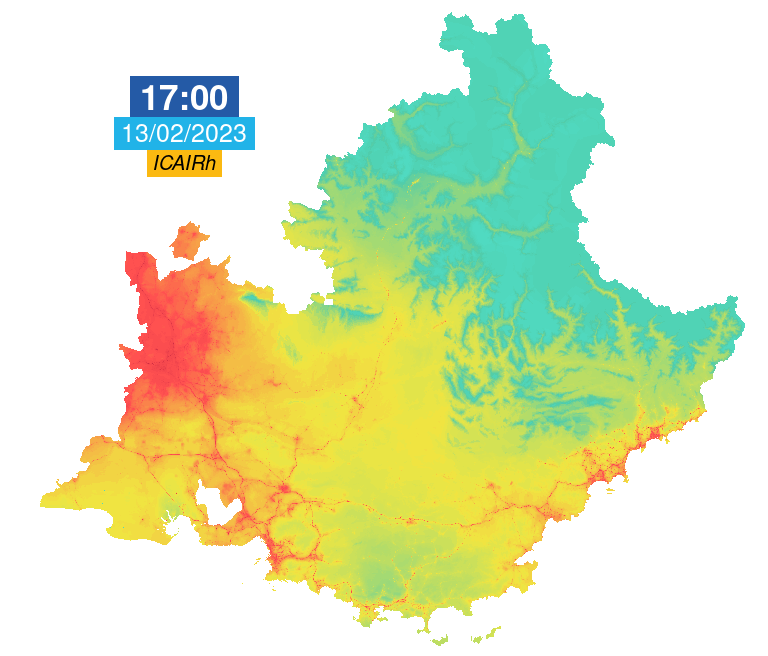
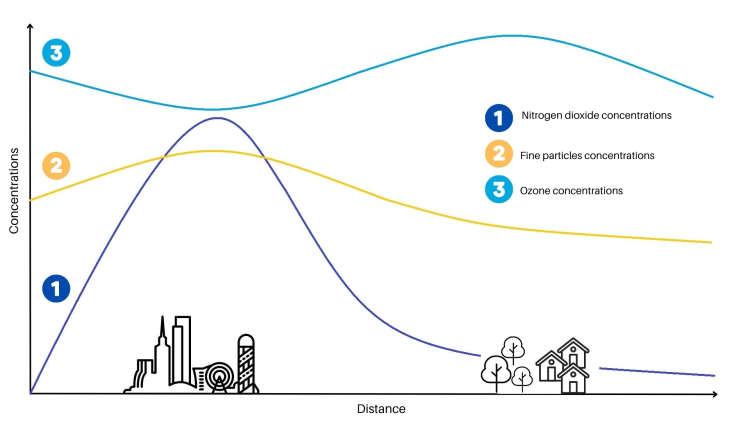
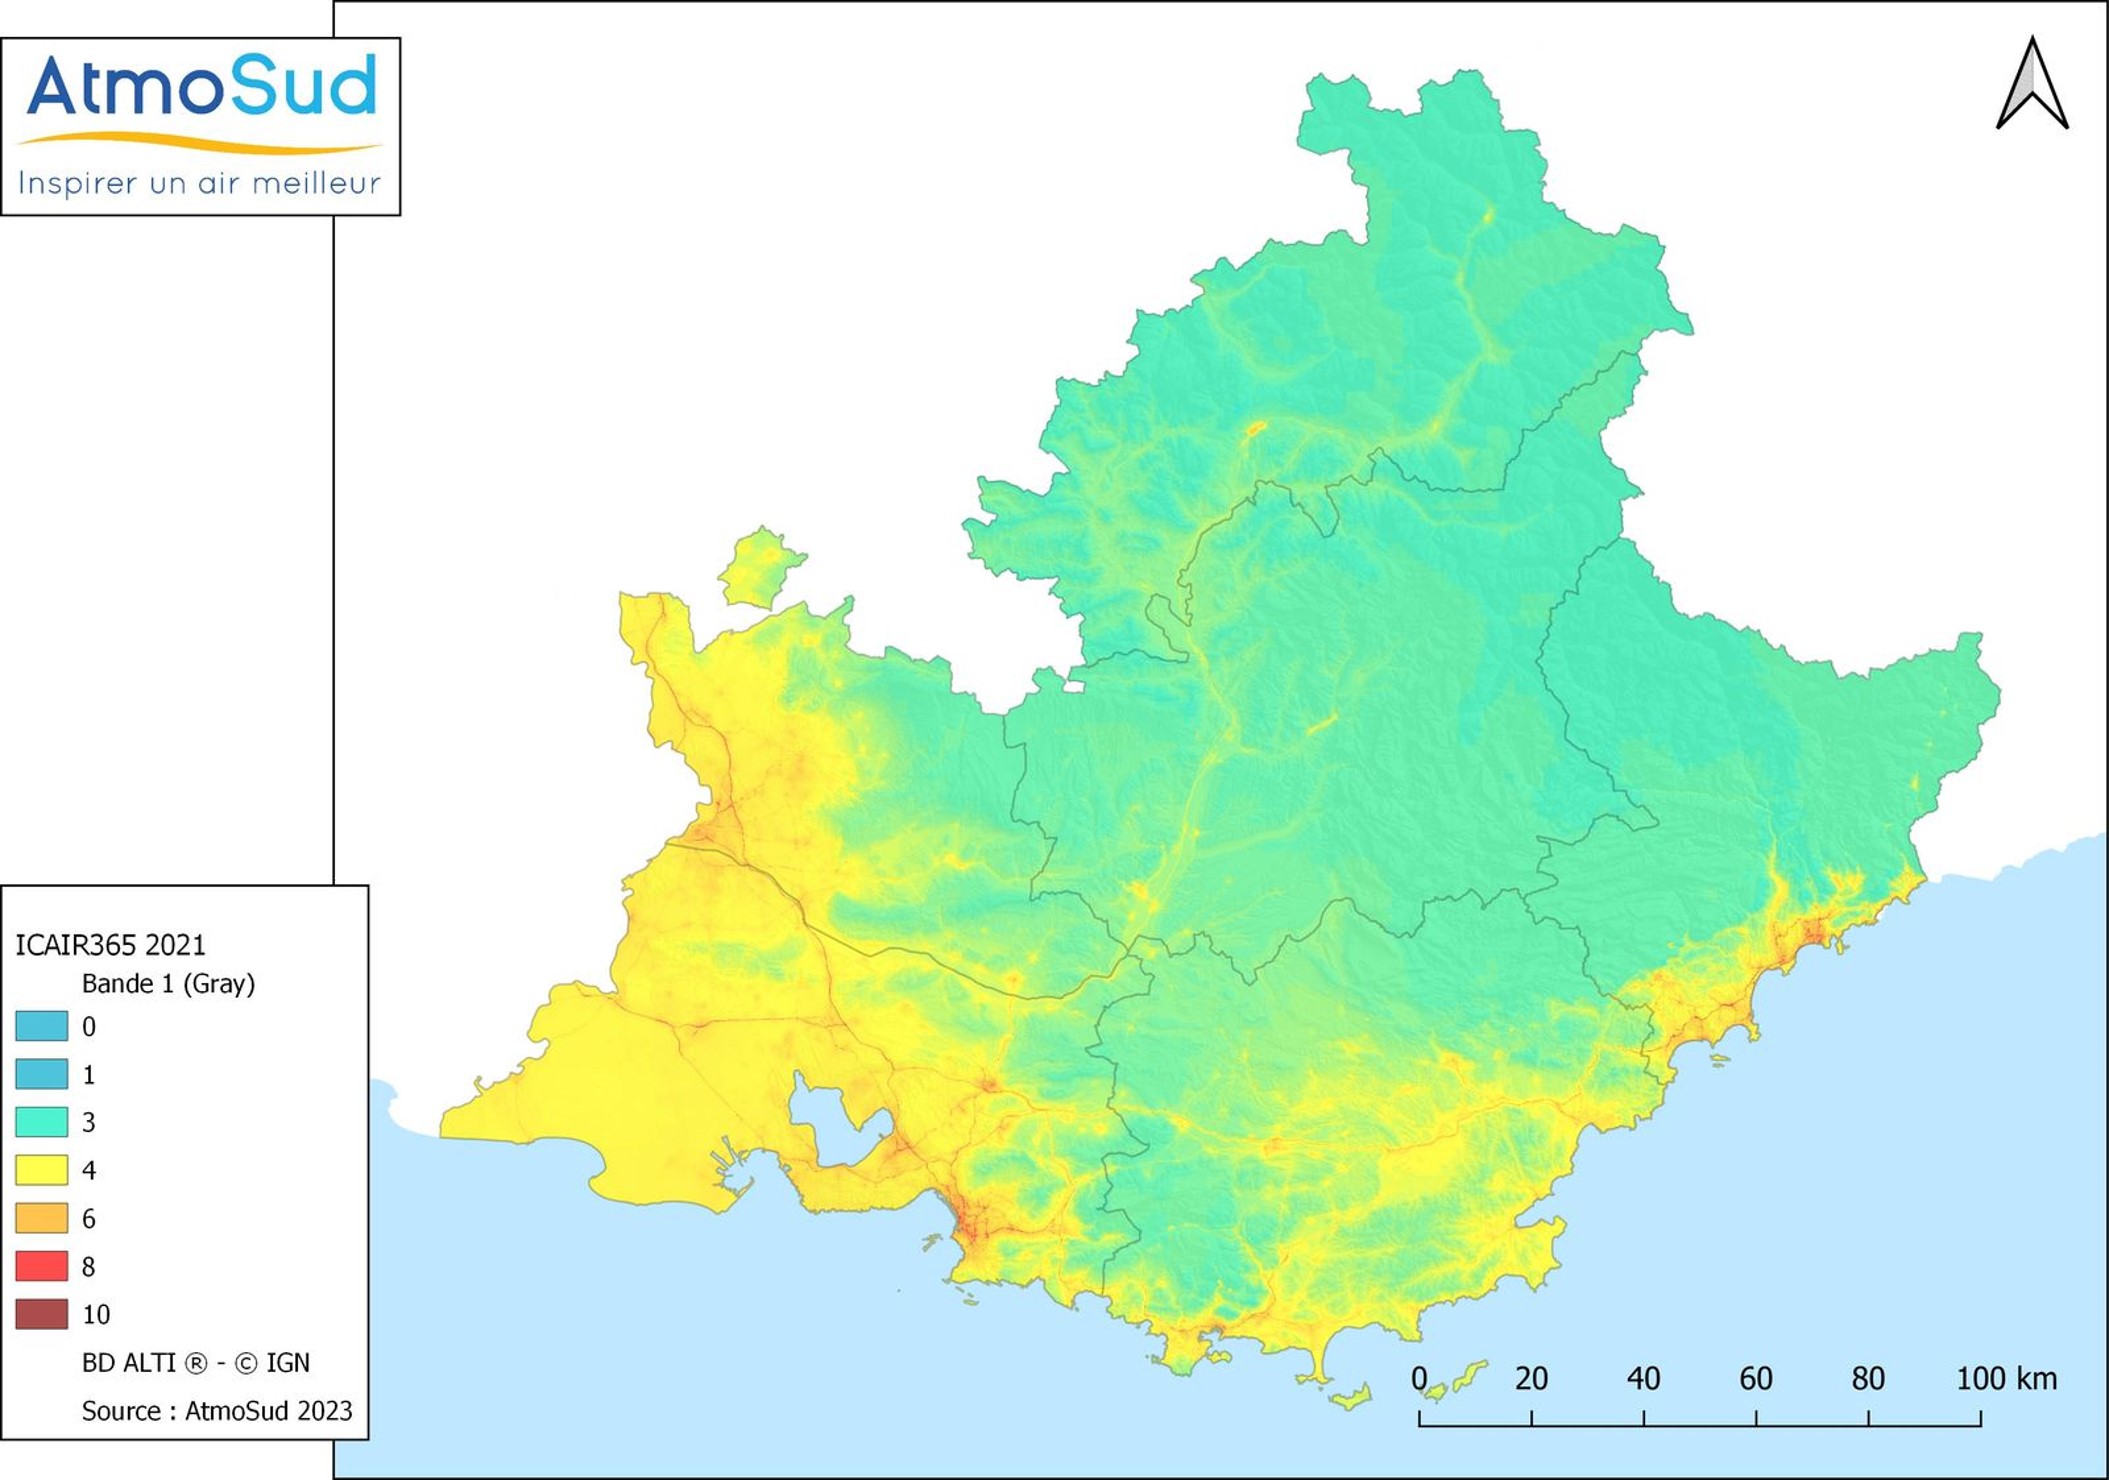
ICAIR (Cumulative Air Index) is an index that cumulates four regulated pollutants (NO₂, O₃, PM2.5, PM10) at the spatial resolution of 25 meters over the entire region (HD modeling with measurement assimilation).

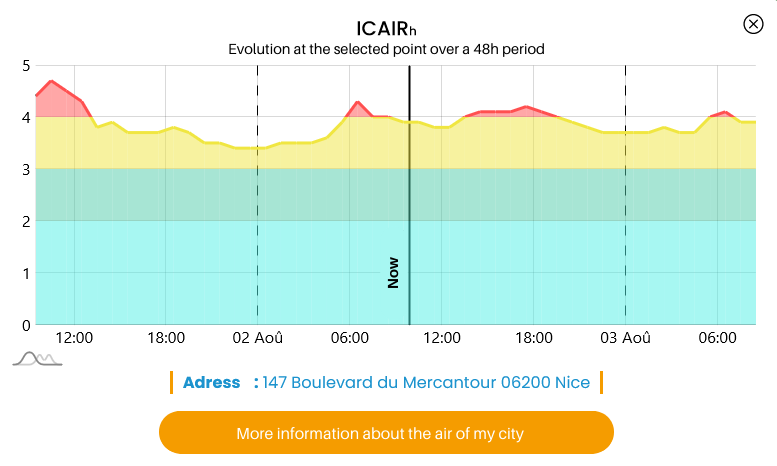
  • There is an hourly version with a 24h forecast so people can take the level of pollution into account in their daily activities: ICAIRh
  • It also exists in an annual version: ICAIR365

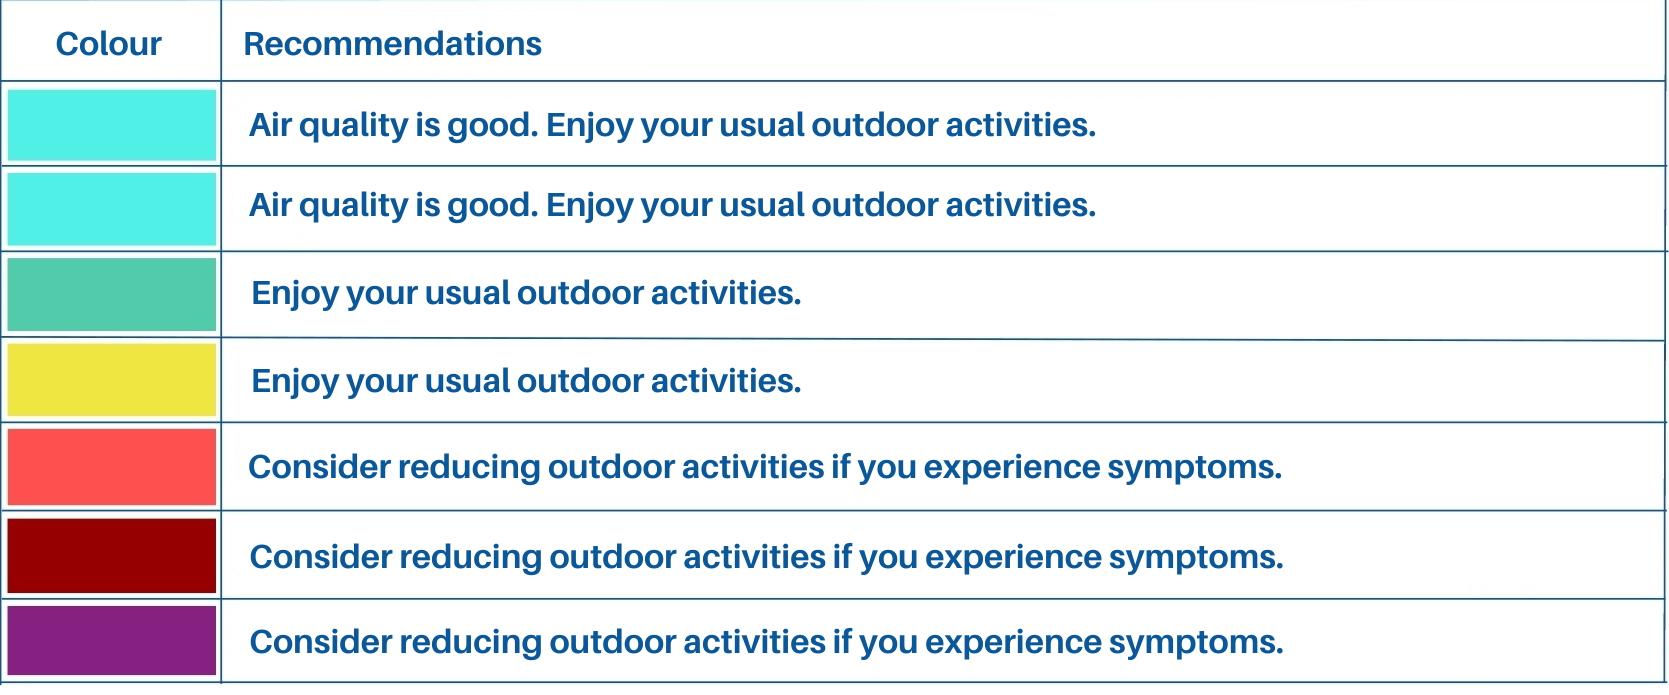
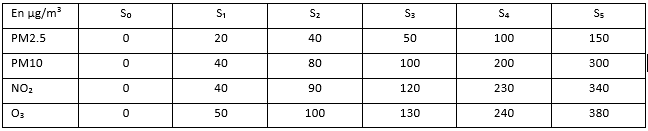
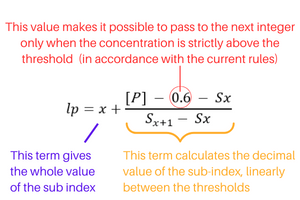
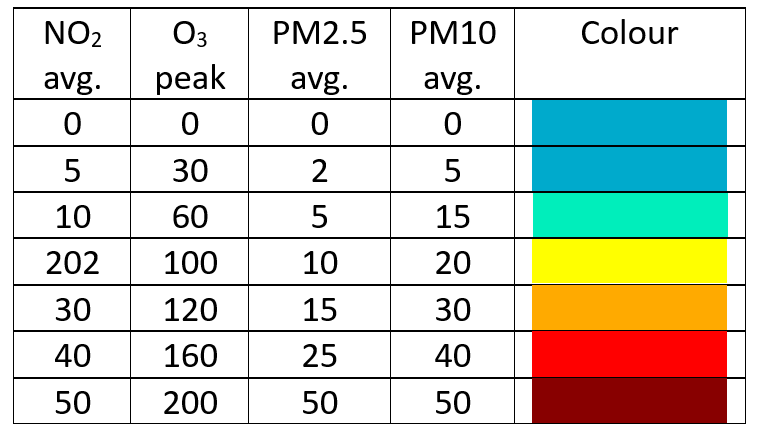
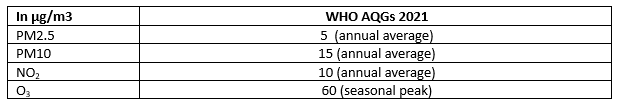
This new index takes into account the cumulative effects of different pollutants, making it possible to highlight areas of multiple exposure. In its hourly version, it’s based on the European Air Quality Index thresholds. In its annual version, it uses the WHO Air quality guidelines (AQG).

Contenu
icairh -13 février 2023
Contenu

Pollution, an accumulation of exposure

The ICAIR index takes into account the cumulation of 4 pollutants (PM10, PM2.5, O3 and NO2), to calculate a unique air quality assessment value.
The choice to consider the sum of those 4 pollutants makes it possible to better assess the exposure of each person to pollution.

Contenu

An example: on this diagram, ozone (O3) (3), nitrogen dioxide (NO₂) (1) and fine particles (PM10 and PM2.5) (2) concentration curves represent a fictional summer day. Ozone concentration is generally the highest level, with a lower level in the city, compared to the suburbs and the countryside. If we considered the only major pollutant, the city could appear to be less polluted than peri-urban areas.

With ICAIRH, each pollutant concentration will be taken into account in the final air quality level assessment. And by making a curve combining the three pollutants, we realize that urban areas are actually more polluted than peri-urban areas.

ICAIRh represents the “multi-exposure” of populations.

Contenu
ICAIR Representation (english)

An index to adapt our daily activity to air quality

Contenu

ICAIRh is an hourly index. It translates, hour by hour, pollution throughout the region. This hourly index uses the European Index threshold, adds to it the principle of cumulation, and allows to schedule activities depending on the level of pollution.

Contenu
ICAIRh legend (english)
Contenu

ICAIRh

The applicable colour scale is a colour gradient as shown here. Depending on the level of pollution, some activities will be more recommended than others in certain areas (peri-urban rather than urban for example).


By clicking on the hourly map on the homepage, you will have access to:


Contenu
ICAIRh hourly data (english)
Contenu

How is the ICAIR index calculated?

  • The weighting of the pollutants is based on:
    • the European Index thresholds, for the hourly index
    • the WHO Air quality guidelines (AQG v2021), for the annual index
  • The indicator varies on an open scale with values generally between 0 and 10, without necessarily being stuck between those thresholds
  • ICAIR provides data rounded to the minimum precision of one digit after the decimal point, allowing the representation of:
    • fine spatial variations
    • pollution without a threshold effect
  • Because of the accumulation of pollutants, there is no exact match between the exceedance of a regulatory threshold and a value of this indicator.

A sub-index Ip is calculated fo each pollutant "p"

For a representation of hourly variation, the hourly average is used for all pollutants. For NO2 and O3, we use the European index thresholds which are already on an hourly basis.

For PM10 and PM2.5 the European thresholds are defined on a daily basis.At the national level, the correlation between daily averages and hourly maximums per day gives a factor of about 2 for both fractions of particles. For the hourly index, we therefore refer to the European index thresholds doubled.

Tableau pour le calcul d'ICAIRh

For a concentration [P] of the pollutant "p" and x between 1 and 5, if Sₓ<[P]<=Sₓ₊₁ (if [P] > S₅, we consider that x = 5) :

ICAIRh equation method

ICAIRh is then calculated as follows:

ICAIRh = max ( IPM10 ; IPM2.5 ) + INO₂ + IO₃

Note: we only take into account the maximum value between IPM10 and IPM2.5 to avoid double counts between PM10 and PM2.5.

Contenu

ICAIR365

ICAIR365 is an annual index. It is based on annual averages of the four pollutants taken into account (PM10, PM2.5, O3 and NO2). These are aggregated together to give an overall picture of air quality over the past year. It then shows exposure to the sum of the four pollutants.

The applicable colour scale is a gradient using the colours of the European Index.

Contenu
ICAIR365 scale
Contenu


WHO Air Quality Guidelines
Contenu

A sub-index Ip (annual average) is calculated for each pollutant  "p"  (NO₂, O₃, PM10, PM2.5), referring to the WHO Air Quality Guidelines (AQG).

For a concentration [P] of pollutant  "p": Ip = [P]/AQGp

ICAIR365 is then calculated as follows:

ICAIR365 = max ( IPM10 ; IPM2.5 ) + INO₂ + IO₃

Note: we only take into account the maximum value between IPM10 and IPM2.5 to avoid double counts between PM10 and PM2.5.

ICAIR365 Map - 2021

Contenu
ICAIR365 2021

Check the ICAIR press kit

Technical Report - ICAIR_0.pdf
Document par défaut
pdf - 29 septembre 2023 - 1.35 MB
Titre
Technical Report - ICAIR
bouton d'actions
ICAIR - PRESS KIT.pdf
Document par défaut
pdf - 26 septembre 2023 - 461.32 KB
Titre
ICAIR Press kit
bouton d'actions